
The National Aeronautics and Space Administration, or NASA, is an independent agency of the United States Government which oversees the civilian space program and other aeronautics and space research. NASA’s contribution to science is expansive, however, and it’s now funded four different initiatives aimed to support scientists, land managers and other decision makers by making biodiversity information more accessible through the implementation of virtual portals.
In a 3 June 2020 press release, written by NASA staff writer Elizabeth Goldbaum, the new initiatives were outlined. Goldbaum writes that NASA’s Advanced Information Systems Technology program’s aim in launching these virtual portals is to improve access to information on terrestrial ecosystems. She writes that “these projects provide critical information to conservationists and policymakers to protect our planet.” The following overviews these recently funded projects as presented in the press release:
Map of Life
The Map of Life is an interactive database that tracks mammals, birds, reptiles, amphibians, as well as some fish, insect and plant species around the world. It draws data from several sources including species range maps, species occurrence points, ecoregions, and protected areas from providers like IUCN, WWF, GBIF, and others. So, if you come across a Monarch butterfly (Danaus plexippus), you can use the Map of Life to learn more including the species’ general characteristics and habitat range. It also includes access to the source data for the different parameters aggregated in the Map of Life interface. For some species, the interface includes projections of species distribution amidst climate change. Just as interestingly, users can also explore patterns of various parameters in the categories of species, phylogeny, and functionality all on both local and global scales.
The Map of Life was also made into a user-friendly app accessible on personal cell phones. I simply entered location as “Bayreuth, Germany,” and was very happy to discover over 1,000 plant species, 122 butterflies, nearly 200 bird species, and many others. Each category of flora and fauna is then further divided into smaller groups which can make identifying what you’re looking for easier. Once you’ve selected a specific species, similarly to the web version, you can see a range map, description, and photographs which help with species identification (if, like me, you’re not so familiar with Bayern flora and fauna).
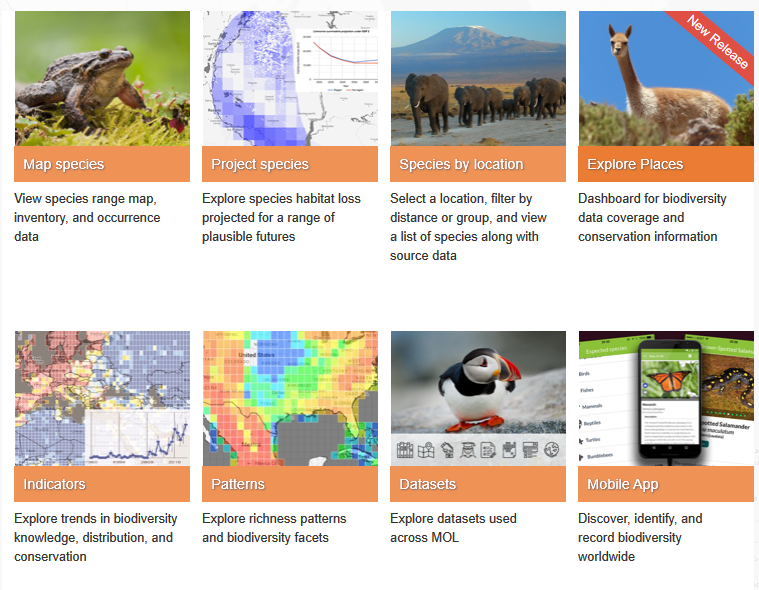
(Image source: https://mol.org/)
Generalized Joint Attribution Model (PDGJAM)
The second exciting project is the Predicting Biodiversity with a Generalized Joint Attribution Model, or PDGJAM. This is another online portal, but this one allows users to explore how biodiverse communities respond to climate change, on both an individual species scale as well as for entire ecosystems. The project was led by Duke University professors Jennifer Swenson and Jim Clark as a product of their interest in determining how one species could impact others as it relocates. In relocating, these species could possibly compete with others for alternative habitats amidst climate change, and this can be insightful information to consider. The platform merges information from the National Ecological Observatory Network, NASA’s remotely sensed Earth data, climate data and other sources to better understand which species may go where amidst varying potential climate scenarios.
The PBGJAM was described by Adam Wilson, a professor at the University of Buffalo in the U.S., as “lowering the barrier for entry for decision makers, scientists and any interested individual to get involved. They only need to choose an ecosystem and then see how it’s shifted.”
Advanced Phenological Information System (APIS)
The third project focuses on phenology. Phenology explores the relationships between climate and periodic biological phenomena such as bird migration or plant flowering. In contrast to the PBGJAM, which takes a more general look at climate change impacts, the Advanced Phenological Information System (APIS) zooms in to explore how climate change can affect the phenology of different species. This could include leafing, flowering, reproduction or migration of different species.
APIS is informed by what is called constellation software which uses millions of field-based observations, satellite data and cameras near the Earth’s surface. Combined, this data allows for the analysis of phenological observations in varying spatial and temporal scales.
Kathy Gerst is a scientist from the USA-NPN who worked with others in creating APIS. She described APIS as “a technology that makes data more accessible and easier to integrate the data from other observational sources…APIS allowed people to bring data together seamlessly.”
APIS is currently supporting efforts at two of the U.S. Geological Survey centers where they examine phenological ties to drought, as well as other work with the U.S. National Park Service, zoos, and nature reserves. And Gerst, mentioned above, used APIS in her and others’ publication which links spring indices to field data on phenological activity in 19 different species of trees and shrubs. This aggregation of data into an open-source platform is surely creating new opportunities not just for scientists, but also other entities with interest in the effects of climate change influences on phenological behaviors.
EcoSIS
Phil Townsend is a professor at the University of Wisconsin-Madison. He led a team in developing the EcoSIS database. The EcoSIS database includes spectral data which helps to support the plant data in the afore-mentioned virtual platforms. Spectral data of vegetation can be an indicator of vegetation health, and changes in vegetation. There is already a lot of this data available from satellite imagery, but it is not always so easy to interface with. In addition to supporting Map of Life, PBGJAM and APIS, Townsend and his team are using EcoSIS to build the Geospatial Spectroscopy Processing Environment (GeoSpec). GeoSpec will be a cloud-based data-system which will allow users to access and interact with the spectral data without having to download it and manipulate it on their local drives. This is helpful because these datasets can be cumbersome and require a lot of computing power. GeoSpec is being designed to provide interested users the opportunity not to just access the data, but also to work with it in an easier way.
Going Forward
Each of these virtual platforms are continuing to evolve. An overarching goal is to make the data and analysis tools provided via these platforms more accessible to users with mixed skills sets and to develop and share new information products. NASA continues to meaningfully contribute to the collective effort of monitoring and understanding planet Earth.
I am a Master Gardener with a BSc in Sustainable Living. Currently, I am a MSc student of Global Change Ecology at the University of Bayreuth.


very good thanks
goooooooooooooooooooooood